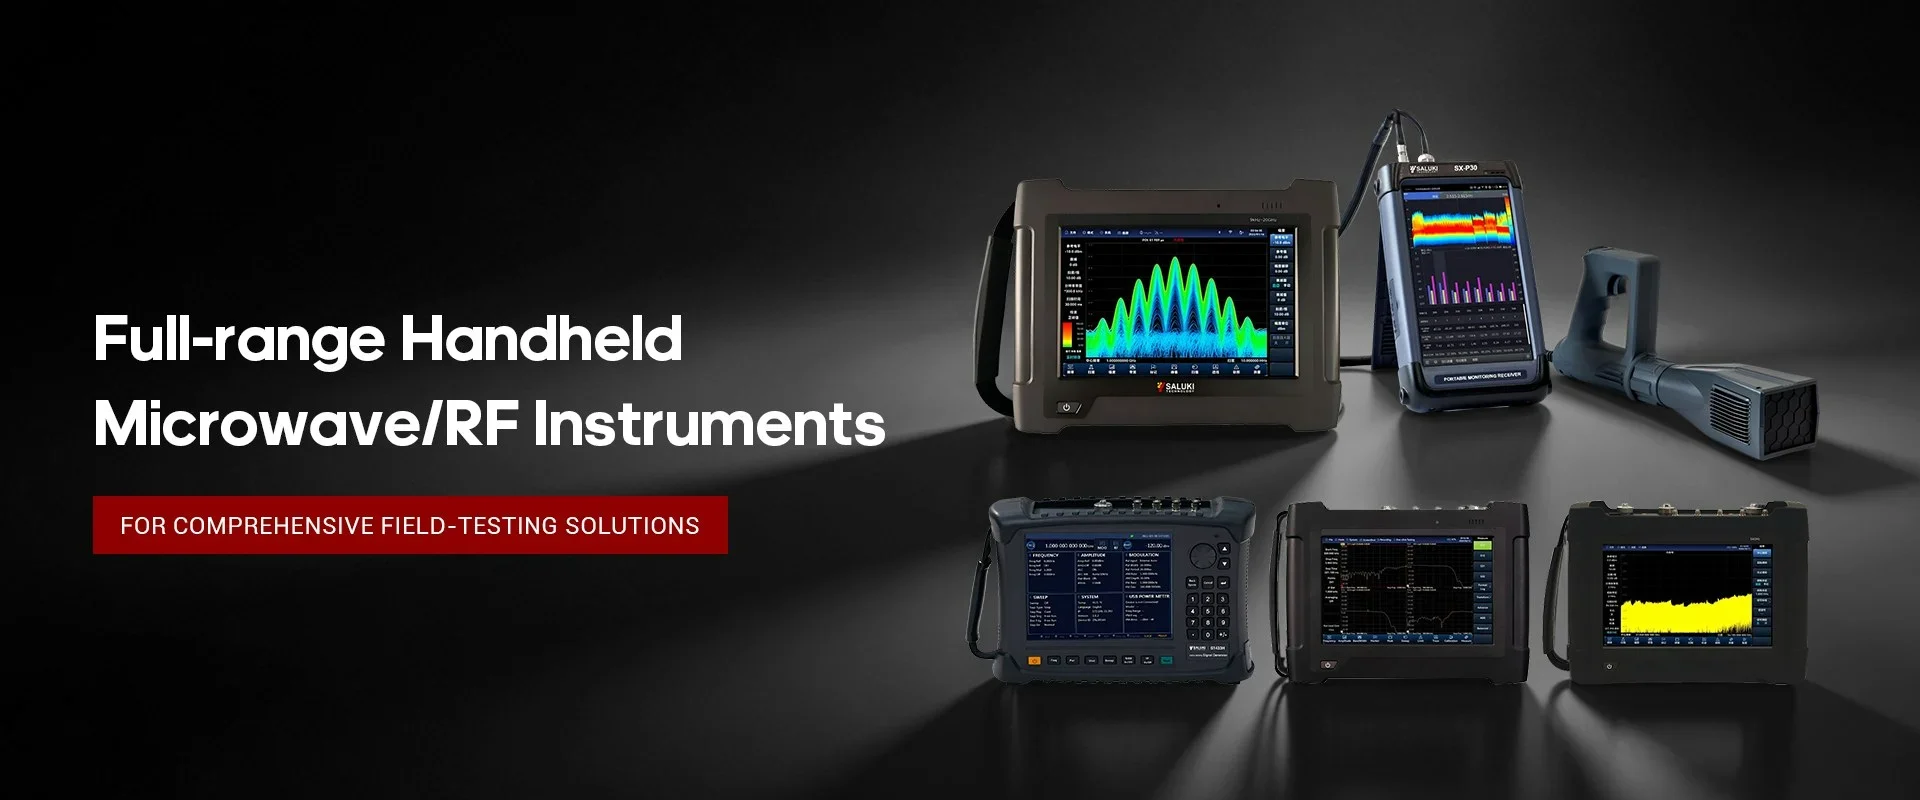
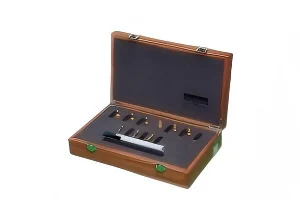
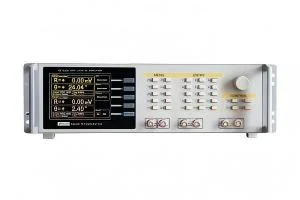
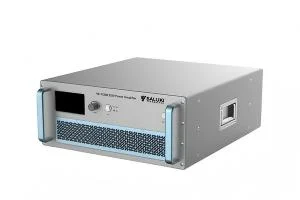
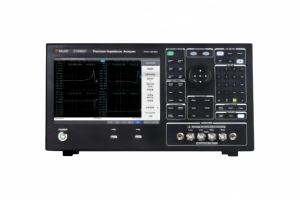
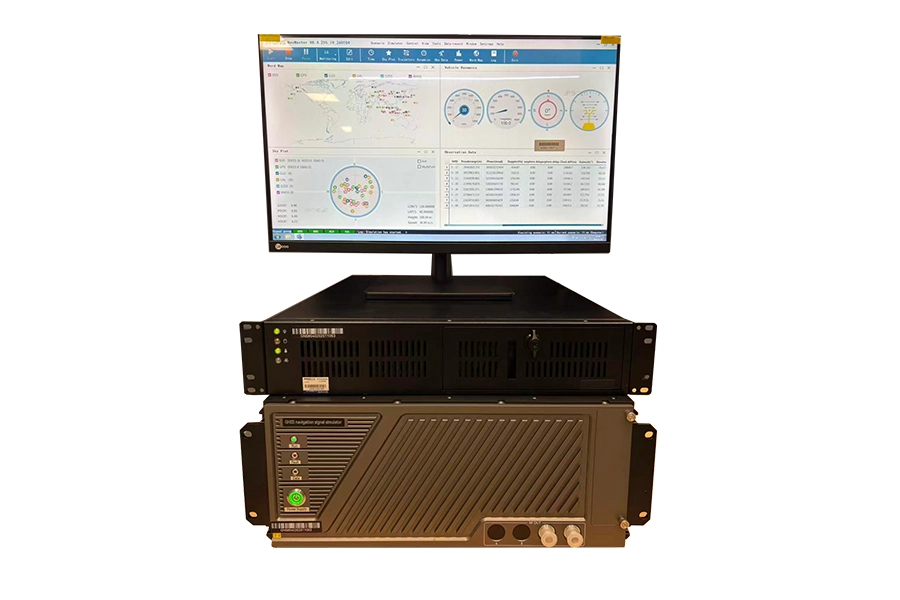
Best Selling Products
Contact us: sales@salukitec.com
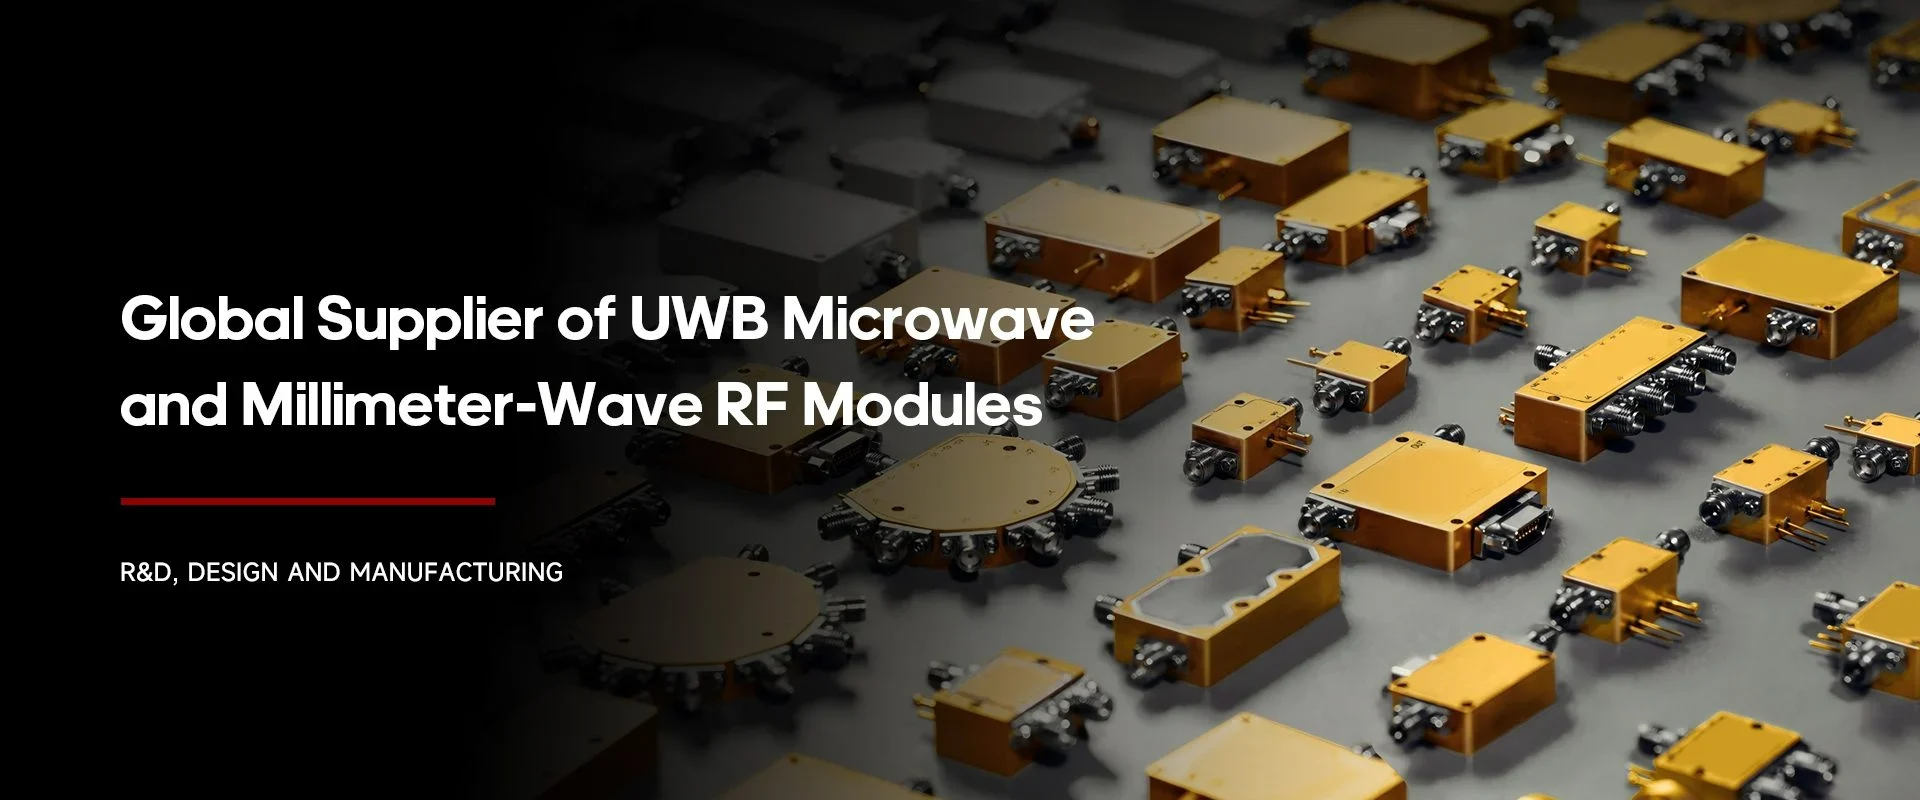
As a professional RF, microwave, and millimeter-wave products manufacturer and supplier in China.
Whether you’re a reseller, distributor, solution provider, or startups, we have a solution to help you grow your business and bring new solutions to market. We believe it is a great opportunity for you to grow with us.
Company Profile
Overview
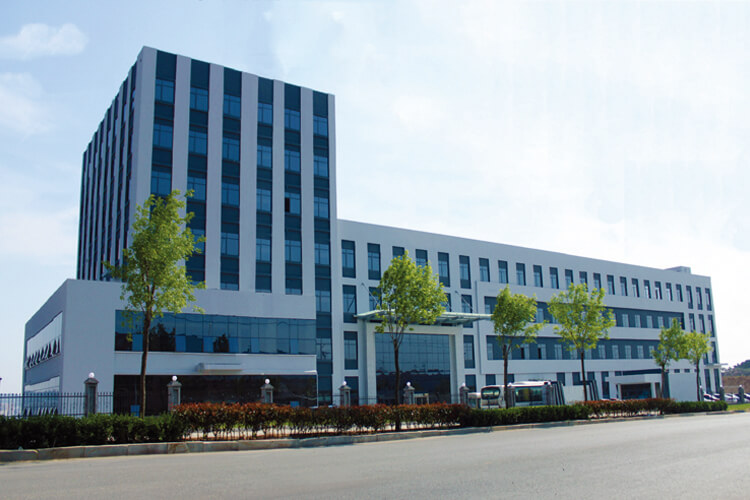
Saluki Technology Inc. is a high-tech company, supplier and manufacturer of High-end RF&MW Test Equipment, General Test Equipment, Lab Equipment and Optical Communication Equipment. Founded in 1997, the company was initially an agent of telecommunication equipment, and it once ranked second in the Chinese market. With an in-depth understanding of the market and user needs, meantime a deep accumulation of technology, the company began to develop its own brand of test equipment in 2008, and promoted it mainly for the Asian market. Beginning in 2015, the company moved its headquarters to Taiwan, and began to face more overseas markets and built the SALUKI brand.
At present, the company has exclusive agents in South Korea, Turkey, and stable partners in markets of countries like Canada, Germany, the United States, the United Kingdom, Finland, Poland, Indonesia, Israel, Vietnam, and South America.
We are committed to establishing a stable partnership with local agents to provide customers with the most professional, fast and long-term services.
Our Vision
Accurate, Fast and Reliable
-
20+
Work Experiences
-
100+
Sales Engineers
-
10+
Branch Openings
We can also provide the following brands
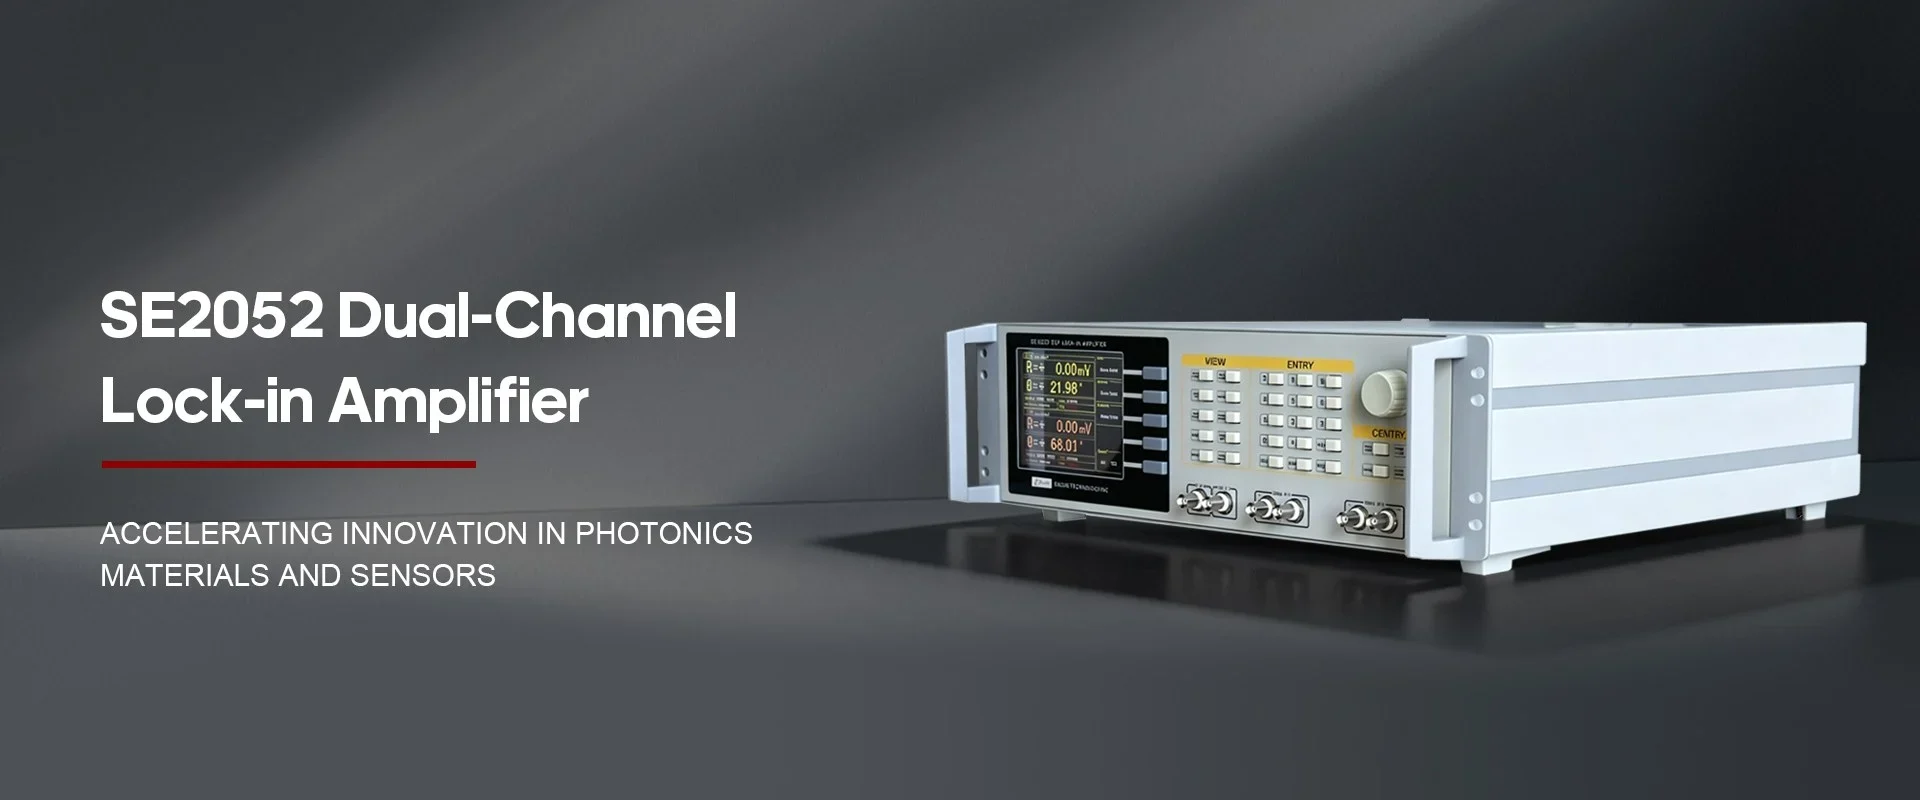
- Application of SE2041 Lock-in Amplifier in Super-Broadband Stimulated Raman Scattering Spectroscopy and Imaging
- [Background of Super-Broadband Stimulated Raman Scattering Technology]
In February 2026, the team led by Xiong Hanqing at Peking University reported a breakthrough in ultra-broadband stimulated Raman scattering (SuperB-SRS) technology in 《Nature Photonics》. In this study, the SALUKI SE2041 lock-in amplifier served as the core signal detection component, enabling the efficient extraction of stimulated Raman loss (SRL) signals with a high signal-to-noise ratio.
Leveraging quantum interference effects driven by few-cycle laser pulses, the technology yields high-fidelity spectra that closely match spontaneous Raman spectra while maintaining spectral resolution at the natural linewidth limit; it also achieves ultra-broadband spectral coverage and increases spectral acquisition speed by more than a hundredfold. Regarding medical applications, the team successfully detected 11 types of biomarkers in clinical serum samples using this technology.
[SE2041 Lock-in Amplifier: Core Detection Component of SRS System]
Design and Principles of SuperB-SRS
Building upon the transient SRS configuration, this study innovatively employs few-cycle pulses as the excitation source to simultaneously excite multiple Raman vibrational modes. During the time delay between two consecutive excitation pulses, quantum interference occurs between the probability amplitudes accumulated in the vibrationally excited states; the SRL signal is a direct manifestation of this interference. By scanning the time delay, the free induction decay (FID) is encoded into the SRL signal; subsequent Fourier transformation yields a broadband Raman spectrum approaching the natural linewidth limit.
To overcome dispersion-induced spectral broadening, the Stokes and pump beams are combined and coupled into a polarization-maintaining single-mode fiber. Self-phase modulation is utilized to broaden the spectrum to a level supporting few-cycle pulses, while a combination of prisms and grating pairs is employed for precise dispersion compensation (Figs. 2a, b).
This design supports flexible tuning of the pump bands, with the two bands collectively covering a broad spectral range of 600–3500 cm⁻¹. With pulse energies on the order of 100 pJ and an objective numerical aperture of 0.4, the research team successfully acquired clear FID signals for multiple Raman modes (Fig. 2c). The spectra obtained via Fourier transformation show excellent agreement with reference spontaneous Raman results (Fig. 2d, top panel).
Taking the ring deformation mode of 1-naphthonitrile as an example, the measured full width at half maximum (FWHM) is 5.5 ± 0.5 cm⁻¹, close to the 6.3 ± 0.2 cm⁻¹ measured by spontaneous Raman spectroscopy (Fig. 3), confirming that the spectral resolution approaches the natural linewidth limit. SuperB-SRS technology is completely immune to fluorescence, enabling the acquisition of fine spectral structures even against a strong fluorescence background (Fig. 2d, bottom panel).
Operating at biocompatible laser intensities, SuperB-SRS requires an acquisition time of only 8 ms, representing a speed improvement of over 100-fold compared to spontaneous Raman spectroscopy (Fig. 4).
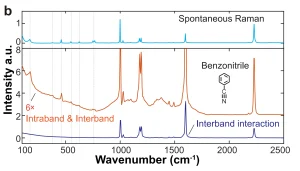
System sensitivity tests demonstrate that the vibrational modes of Rhodamine 800 in the fingerprint region can be detected down to a concentration of 20 μM, and the C-H stretching mode of 1 mM dimethyl sulfoxide can also be faithfully recorded; the system’s sensitivity is primarily limited by a dynamic range of approximately 60 dB (Figure 5). Furthermore, by selectively filtering out certain low-frequency components from the pump band, the spectral coverage was extended downward from 2500 cm⁻¹ to 100 cm⁻¹, achieving full spectral coverage (Figure 6).
Figure 1. Schematic diagram of the principle of quantum interference encoding.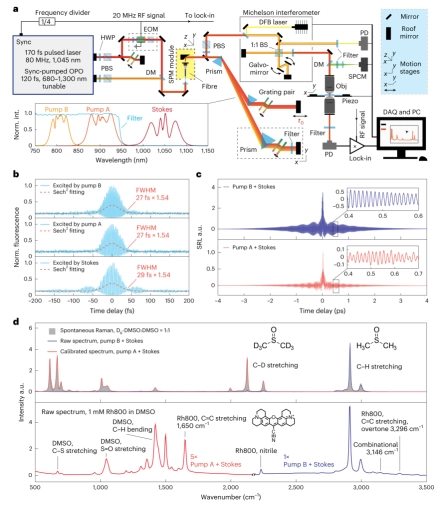
Figure 2. SuperB-SRS system setup and spectral performance:
(a) SuperB-SRS system setup;
(b) pulse autocorrelation at the focal point;
(c) time-domain SRL signal;
(d) reconstructed Raman spectrum.
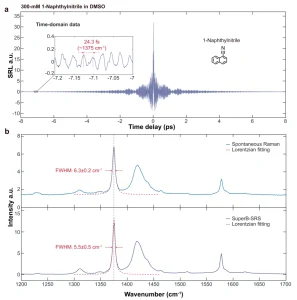
Figure 3. Comparison of time-domain SRL signals and spectra for 1-naphthonitrile:
(a) time-domain SRL signal;
(b) comparison of the SuperB-SRS spectrum (bottom) and the spontaneous Raman spectrum (top).
Figure 4. Comparison of spectral acquisition time and signal-to-noise ratio between SuperB-SRS and spontaneous Raman spectroscopy on the same sample.
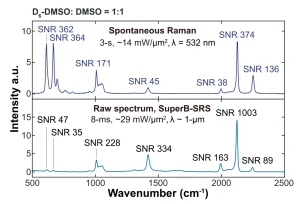
Figure 5. Sensitivity characterization of SuperB-SRS.
(a–c) Raman spectra and linear fits of Rhodamine 800 in D₆-DMSO at various concentrations;
(d–f) Raman spectra and linear fits of DMSO in D₂O at various concentrations.
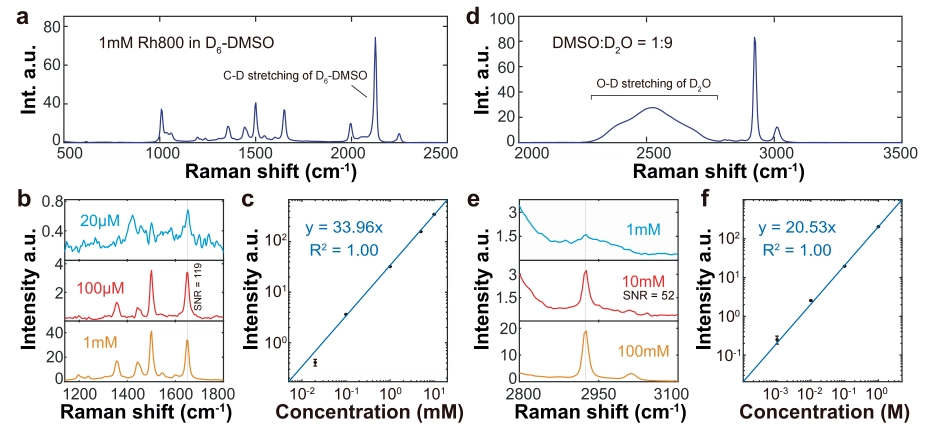
Figure 6. Spectral filtering strategy achieving full-spectrum coverage down to 100 cm⁻¹.
Research Findings
In imaging experiments on mouse liver tissue, the acquisition of 140 × 200 spectral points was completed within approximately 10 minutes, identifying over 19 characteristic Raman peaks (Figure 7). For multimodal brain tissue imaging, a classifier based on single-cell SuperB-SRS spectra effectively distinguished astrocytes, achieving a classification accuracy of 92 ± 3% and a sensitivity of 92 ± 7% (Figure 8).
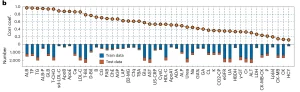
The research team also compiled measurement data from approximately 2,300 serum samples and developed a predictive model covering more than 50 biomarkers, with 11 key biomarkers demonstrating particularly outstanding predictive performance (Figure 9); the entire detection process requires only 50 μL of serum and an acquisition time of just a few seconds.
Figure 7. Comparison of Raman spectra from the outer and inner regions of lipid droplets.
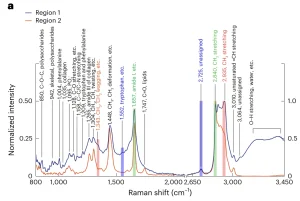
Figure 8. Performance of the cell classification model based on single-cell SuperB-SRS spectra.
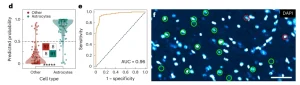
Figure 9. Correlation coefficients and sample sizes for prediction models of 50 different biochemical indicators.
[Summary]
The SuperB-SRS technique integrates collinear dual-band excitation and high-frequency lock-in detection in the frequency domain with pulsed excitation and quantum coherent control in the time domain. It offers a versatile solution for high-speed Raman spectroscopic analysis and imaging—combining high fidelity, high resolution, broad bandwidth, and excellent sensitivity—and demonstrates broad application prospects in the field of biomedical detection.
