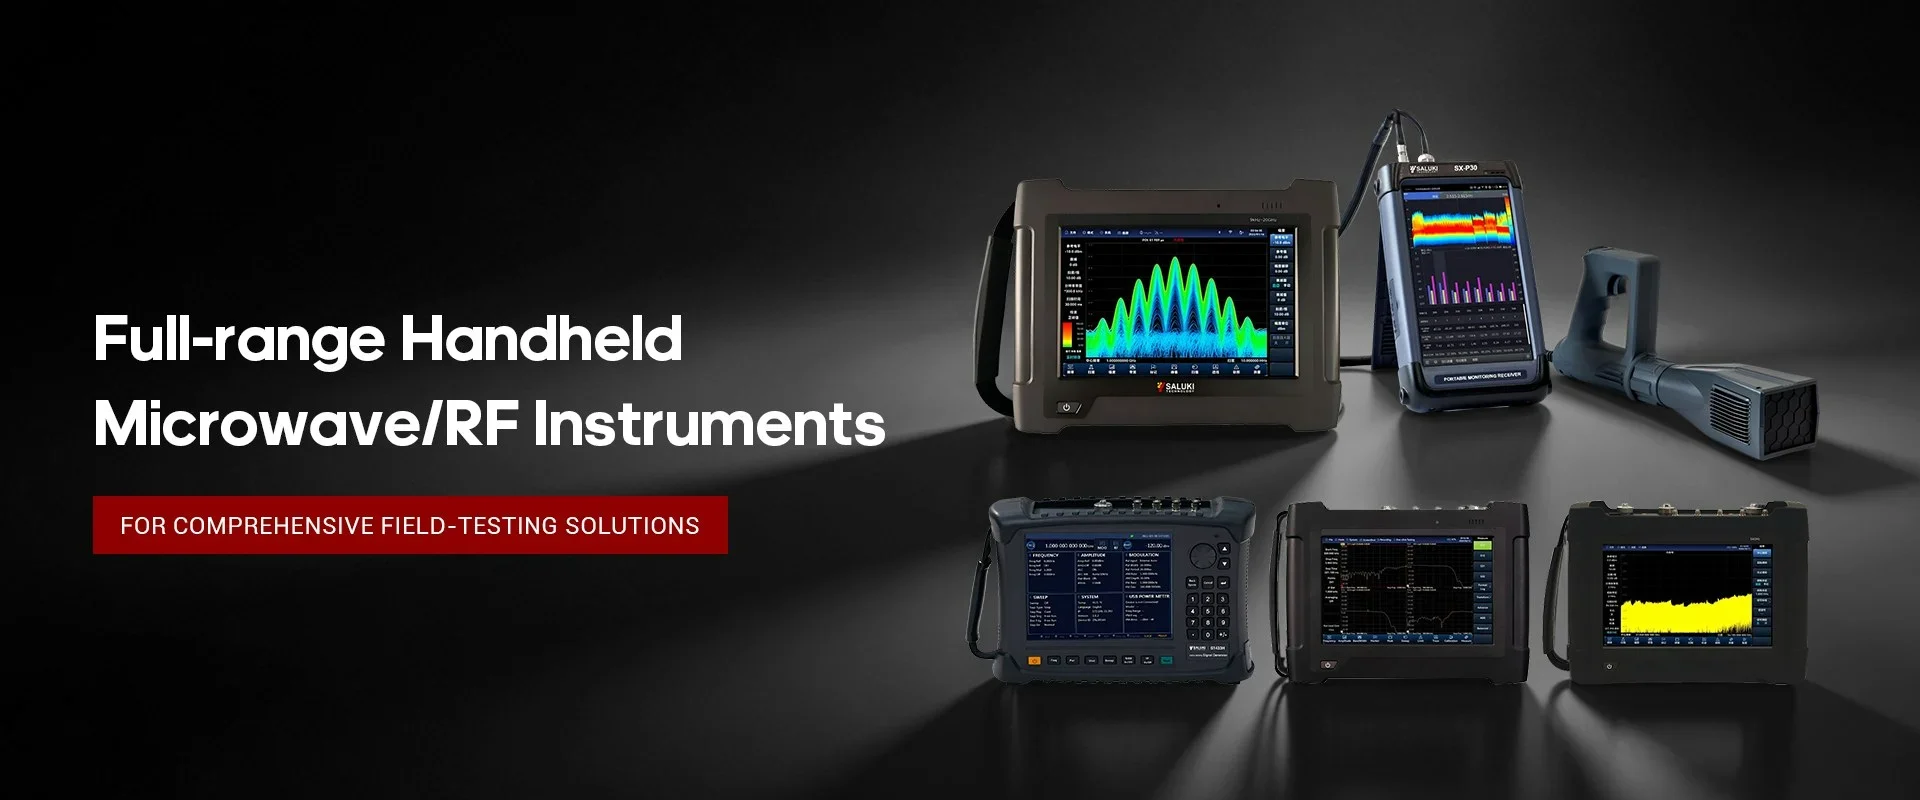
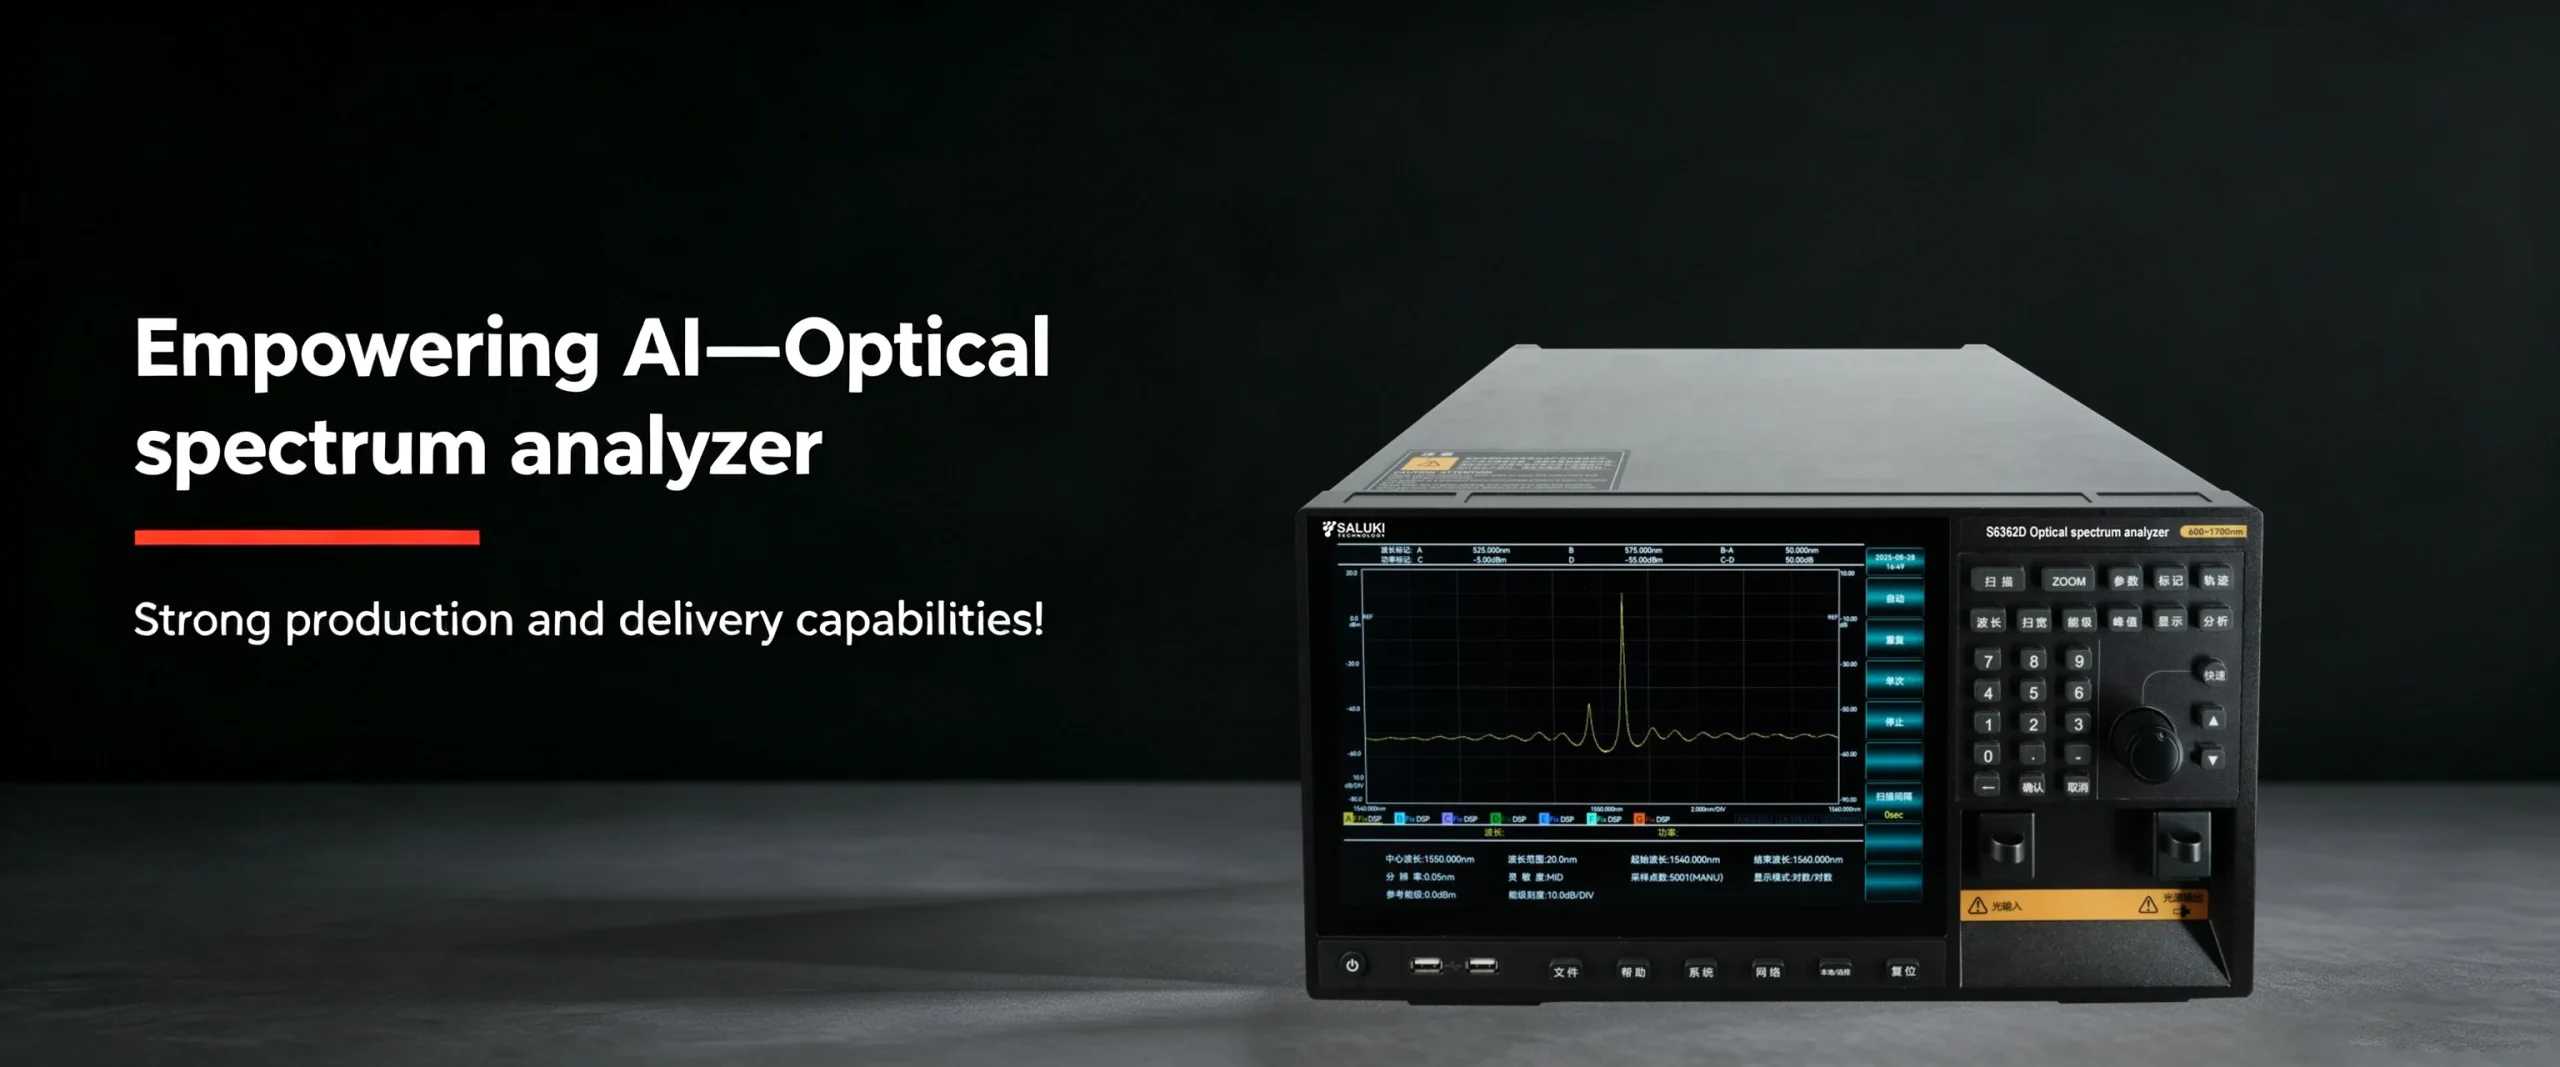
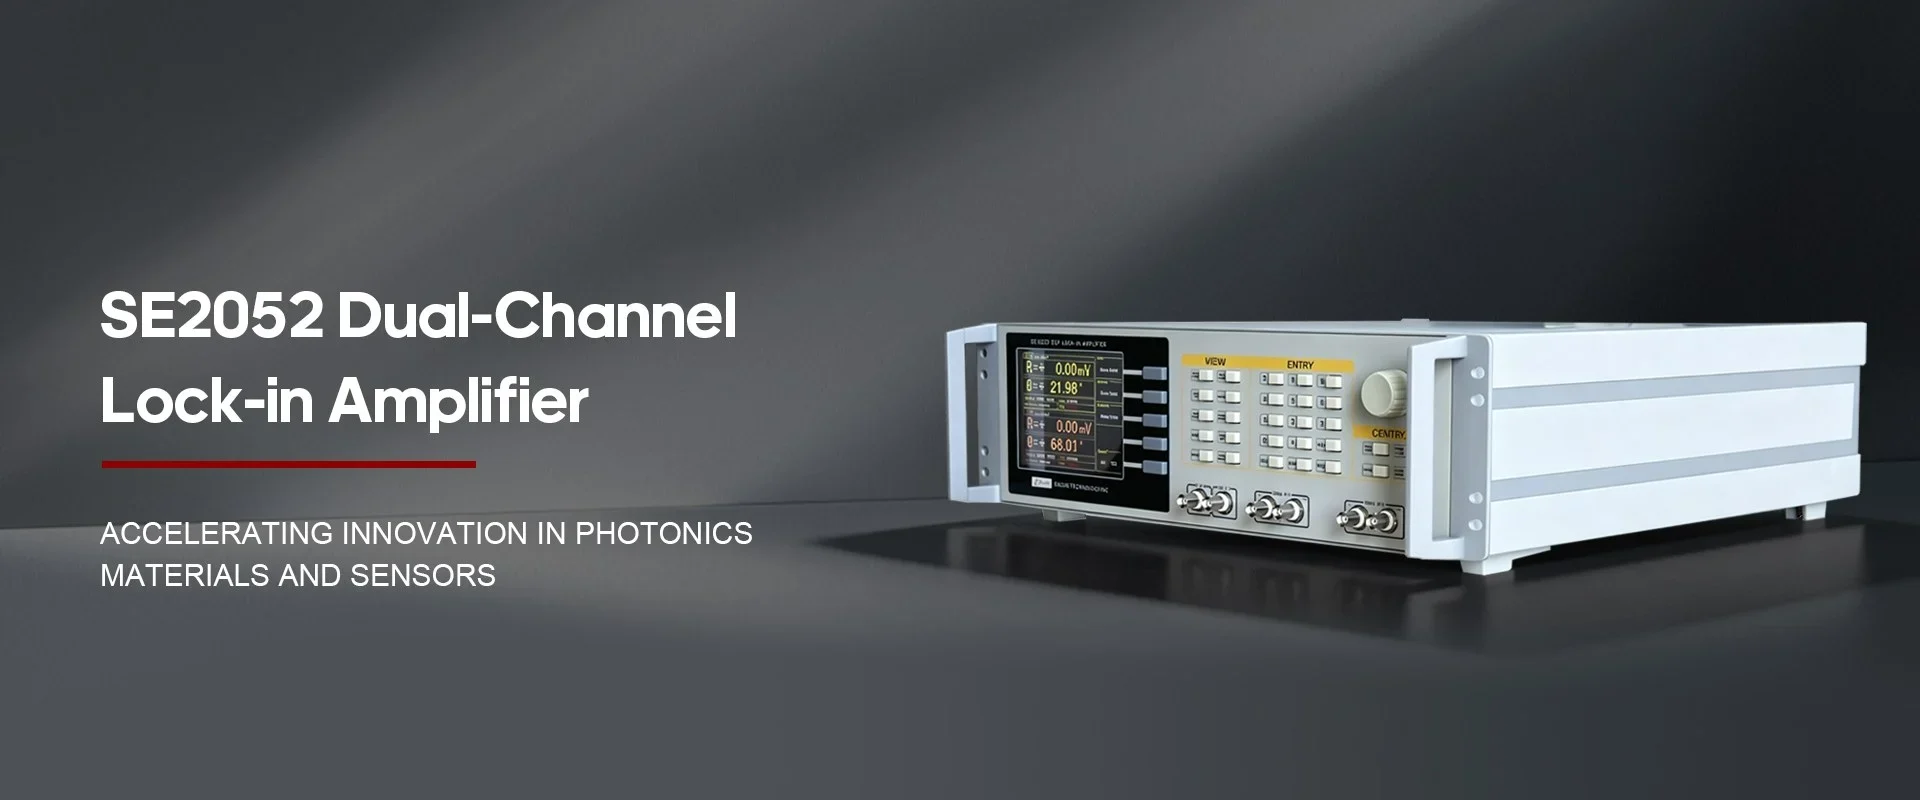
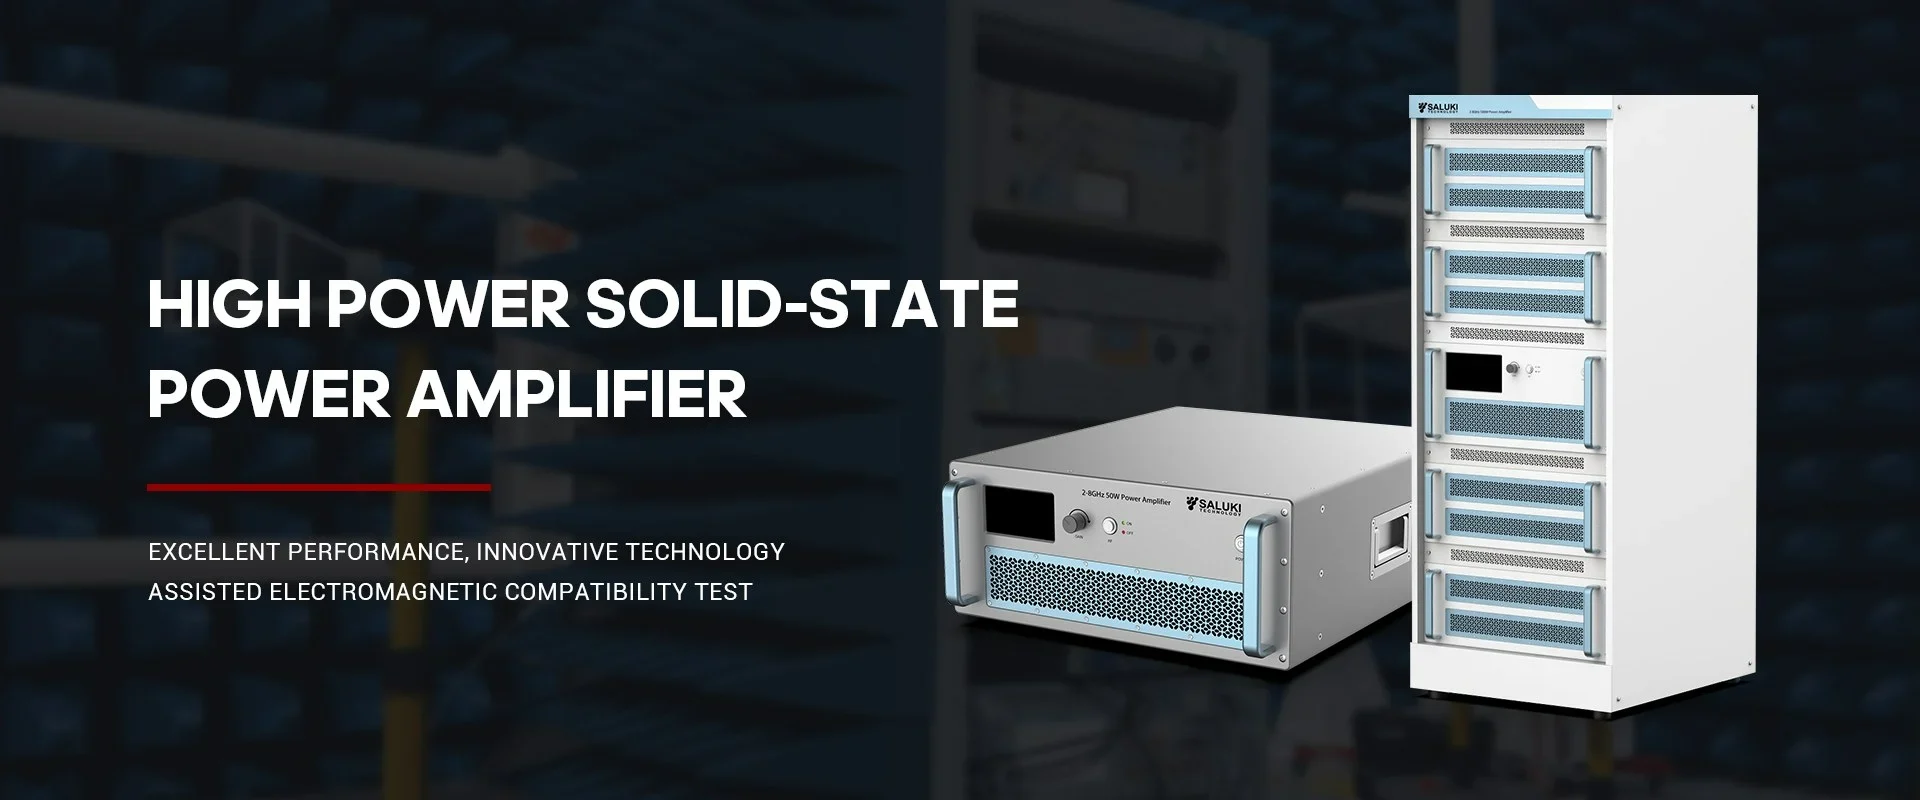

Best Selling Products
Contact us: sales@salukitec.com
As a professional RF, microwave, and millimeter-wave products manufacturer and supplier in China.
Whether you’re a reseller, distributor, solution provider, or startups, we have a solution to help you grow your business and bring new solutions to market. We believe it is a great opportunity for you to grow with us.
Company Profile
Overview
Saluki Technology Inc. is a high-tech company, supplier and manufacturer of High-end RF&MW Test Equipment, General Test Equipment, Lab Equipment and Optical Communication Equipment. Founded in 1997, the company was initially an agent of telecommunication equipment, and it once ranked second in the Chinese market. With an in-depth understanding of the market and user needs, meantime a deep accumulation of technology, the company began to develop its own brand of test equipment in 2008, and promoted it mainly for the Asian market. Beginning in 2015, the company moved its headquarters to Taiwan, and began to face more overseas markets and built the SALUKI brand.
At present, the company has exclusive agents in South Korea, Turkey, and stable partners in markets of countries like Canada, Germany, the United States, the United Kingdom, Finland, Poland, Indonesia, Israel, Vietnam, and South America.
We are committed to establishing a stable partnership with local agents to provide customers with the most professional, fast and long-term services.
Our Vision
Accurate, Fast and Reliable
-
20+
Work Experiences
-
100+
Sales Engineers
-
10+
Branch Openings
We can also provide the following brands
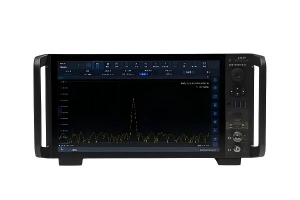
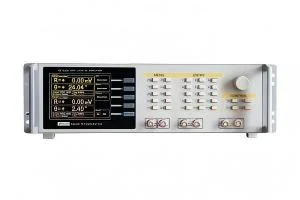
Saluki S3503 series signal/spectrum analyzer is featured with wide frequency range (up to 67GHz), excellent dynamic range, low phase noise, precision amplitude and high testing speeds. S3503 signal/spectrum analyzer is available for using programming commands.
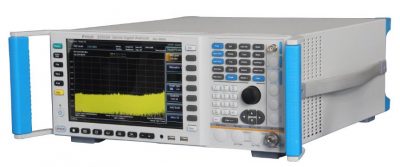
Fig.1 S3503 Signal/Spectrum Analyzer
In this section, we mainly introduce the programming interface of S3503 series.S3503 series signal/spectrum analyzer is compatible only to two remote control interfaces: LAN and GPIB, as shown in the following table1.
Table 1 Programming interface of S3503 series
| Remote Control Interface |
VISA address character string (note 1) | Instructions |
| LAN | Original socket protocol: TCPIP::host_address::port::SOCKET | Remote control can be realized by the connecting the instrument through the network port on the rear panel of the instrument. For details, refer to: 6.1.2.1 LAN Interface. |
| GPIB | GPIB::primary address[::INSTR] | Remote control can be realized by the connecting the instrument through the port on the rear panel of the instrument. Comply with the bus interface standards of IEC 625.1/IEEE418. For details, refer to: 2.1.2.2 GPIB Interface. |
1. LAN Interface
The signal/spectrum analyzer can be controlled remotely by the 10Base-T and 100Base-T LAN computer. Various instruments in the LAN are combined into a system for unified control with the computer in the network. In order to realize the programming within LAN, the signal/spectrum analyzer should be configured with a port connector, network card, relevant network protocol and network service in advance. At the same time, the controlling computer in the network should be configured with the instrument control software and VISA library in advance. Three working modes of the network card:
a) 10Mbit/s Ethernet IEEE802.3;
b) 100Mbit/s Ethernet IEEE802.3u;
c) 1Gbit/s Ethernet IEEE802.3ab. Connect the controlling computer and signal/spectrum analyzer to a common TCP/IP protocol network through the network ports.
Use the RJ45 commercial cable (shielded or non-shielded Class 5 twisted pair) between the computer and the signal/spectrum analyzer. Use the packet transmission mode in data transmission, as the speed of LAN transmission is high. In general, the cable between the computer and the signal/spectrum analyzer should not be longer than 100 m (100Base-T and 10Base-T). The LAN interface will be described below in detail:
(1) IP address
Ensure that the physical connection of network is smooth for programming of the signal/spectrum analyzer by LAN. Through the “Local IP” command of the signal/spectrum analyzer, set the address to the subnet where the controlling computer is located. Example: If the IP address of the master control computer is 192.168.12.0, the IP address of the signal/spectrum analyzer should be set as 192.168.12.XXX, in which, XXX is a value between 1 and 255.
Only the IP address is required to establish the network connector. The VISA addressing character string is as follows:
TCPIP::host address::port::SOCKET Where:
a) TCPIP refers to the applied network protocol.
b) “Host address” refers to the IP address or host name of the instrument, used to identify and control the instrument to be controlled.
c) “port” refers to the socket port number of the S3503 signal/spectrum analyzer;
d) SOCKET refers to the original network socket resource class.
Example:
If the instrument IP address is 192.1.2.3:
“TCPIP::192.1.2.3::5000::SOCKET” can be used for establishing the original socket connection.
(2) Socket communication
TCP/IP protocol can be networked with the signal generator using LAN socket. Socket is a basic approach used in computer network programming, which enables network communication among applications employing different hardware and operating systems. In this method, the signal/spectrum analyzer is connected to the computer through the port for two-way communication.
Socket is a specially-complied software generic, which includes the definitions of IP address, equipment port number and other information essential to networking and integrates some basic operations of network programming. Socket can be used as long as the packaged libraries are installed in the OS. Two common socket libraries are the Berkeley socket library applied in UNIX and the Winsock library applied in Windows respectively.
The socket of the signal/spectrum analyzer is compatible with the Berkeley socket and Winsock through the application program interface (API). Besides, it is also compatible with other standard socket API. The command will be sent by the socket program to control the signal/spectrum analyzer through SCPI commands. Before you use LAN socket, you must set the port number of the socket of the signal/spectrum analyzer: 5000.
2. GPIB Interface
The GPIB is a kind of programming interface which is widely applied at present. Various kinds of instruments can be connected through GPIB cables to form a test system with the master control computer. In order to realize programming, the master control computer should be configured with the GPIB bus card, drive program and VISA library in advance. In the communication process, the controlled instrument is addressed by the master control computer according to the GPIB bus address, and the user can set the GPIB address and ID query string. The default GPIB communication language can be SCPI command.
Refer to ANSI/IEEE 488.1-1987 and ANSI/IEEE 488.2-1992 for detailed definitions and descriptions on GPIB and relevant interface operations.
The byte is used in information processing of GPIB. The data transmission rate can reach 8MBps. Therefore, the speed of data transmission of GPIB is high. The data transmission speed is limited by the distance between the equipment/system and computer. In GPIB connection, note that:
a) At most 15 instruments can be connected through GPIB interfaces.
b) The total length of the transmission cable must not exceed 15m or twice of the number of instruments in the system. Generally, the maximum length of the transmission cable between devices must not exceed 2m.
c) For parallel connection of instruments, use “or” connecting lines.
d) Connect the terminal of the IEC bus cable to the instrument or controlling computer.
