
Research direction: Grating sensing composite detection
Experimental content: Focus on studying the influence of the frequency, phase, amplitude, position and other factors of the two excitation source signals on the FBG response characteristics, so as to provide a parameter basis for subsequent damage location.
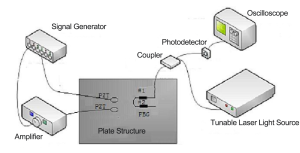
Test equipment: signal generator, SLA-HV-400S power amplifier, tunable laser light source, oscilloscope, photodetector
Experiment procedure:
Build a multi-source excitation detection system: The multi-source excitation-fiber grating sensing detection system scheme based on isotropic plate structure is shown in the figure, which mainly includes the excitation part and the FBG demodulation part. The excitation part includes a signal generator and a high-voltage amplifier (SLA-HV-400S). The FBG demodulation part mainly includes a broadband coupler, an adjustable laser light source, a photodetector, and an oscilloscope. The channel 1 signal of the signal generator is directly applied to the piezoelectric sheet and is amplified by a high-voltage amplifier. The channel 2 signal is applied to the piezoelectric sheet after passing through the signal amplifier. The inverse piezoelectric effect is used to generate strain waves in the plate structure. The FBG sensor The received response is demodulated and converted into an electrical signal by the photodetector, which is displayed on the oscilloscope.
Test Results:
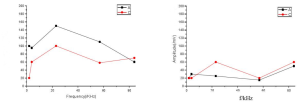
(1) Excitation size parameters
When the parameters of component thickness and excitation amplitude are the same, the larger the diameter, the larger the response amplitude. Therefore, to obtain a larger response amplitude, a size with a larger diameter can be appropriately selected.
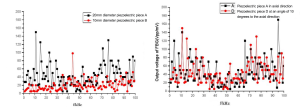
Incentive effects under different sizes
(2) Under the same excitation conditions, compare the FBG sensing response effects at different positions. As shown in the figure, since the excitation A is along the #1FBG axis direction, the black curve in Figure a representing the response of the excitation A is larger. In the same way, since the excitation C is along the axis of #2FBG, the red curve in Figure b represents the response under the action of excitation C. It can be seen that whether #1FBG or #2FBG is facing the detection position of the excitation element, the response effect is better.
FBG response curves at different positions
The performance of the power amplifier in this experiment: voltage amplification and excitation of the piezoelectric film.
