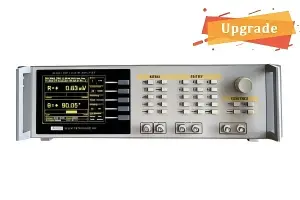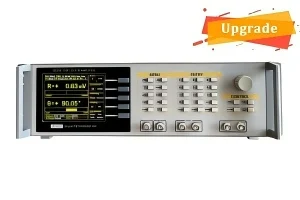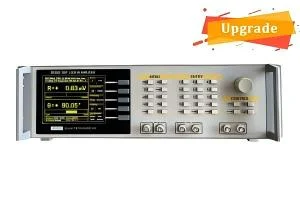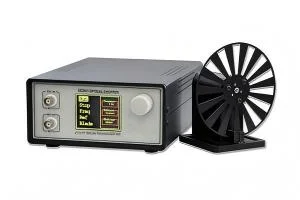

SE2031 DSP Lock-In Amplifier

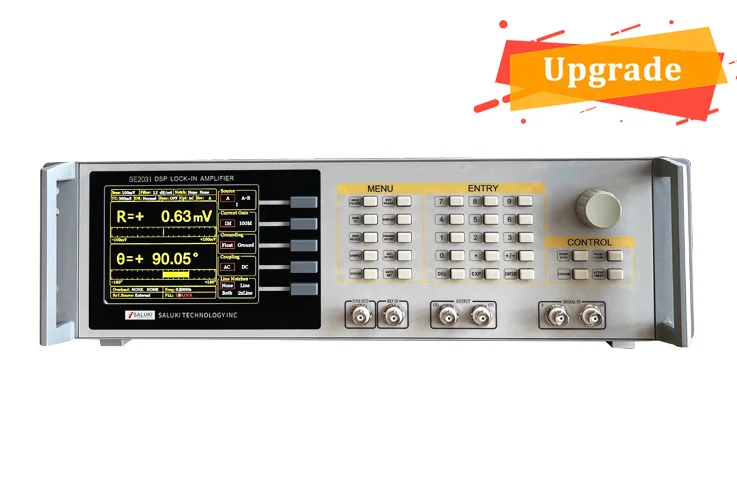
SE2031 Digital Lock-in Amplifier, DC–10 MHz, 250MSa/s, 14 Bit

     • Leveraging the advantages of the latest digital signal processing technology and high-speed 16-bit ADCs, it can effortlessly detect the phase and amplitude of faint signals submerged within various types of intense noise.

     • Its performance not only rivals that of lock-in amplifiers from top-tier brands but, in specific parameters such as measurement accuracy, signal-to-noise ratio (SNR), and dynamic reserve, even surpasses them.

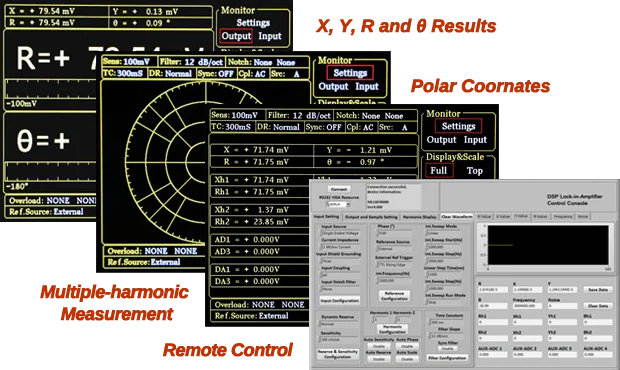
     • Incorporating specialized features—such as multi-harmonic measurement—it is fully capable of meeting the diverse requirements of both scientific research and industrial applications.


Unit Price: US$13,794.00

2 day


Key Features

DC to 10 MHz frequency range

1 nV to 2 V full-scale sensitivity

Time constants from 100 ns to 3 ks

> 120 dB dynamic reserve

A high-performance signal generator

Oscilloscope, spectrum analyzer

PID controller, AM modulation

Up to 6 demodulators

Dual-phase structure guarantees higher accuracy

5.6 inch color TFT-LCD screen, single or dual display

Support remote control, embedded a free LabVIEW program

  • Flowchart Interface

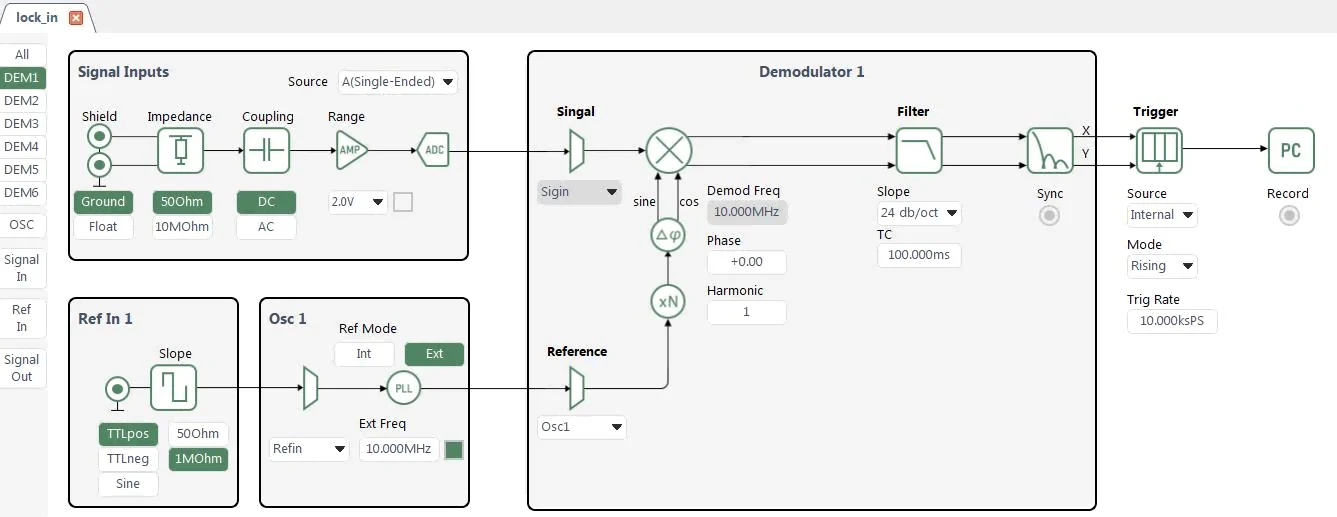
    The SE2031 host software offers an optional flowchart mode for visualizing the lock-in amplifier configuration. This flowchart provides users with a diagram illustrating the instrument’s internal hardware and algorithmic architecture, thereby facilitating an understanding of the function of each parameter.

  • Oscilloscope Functions

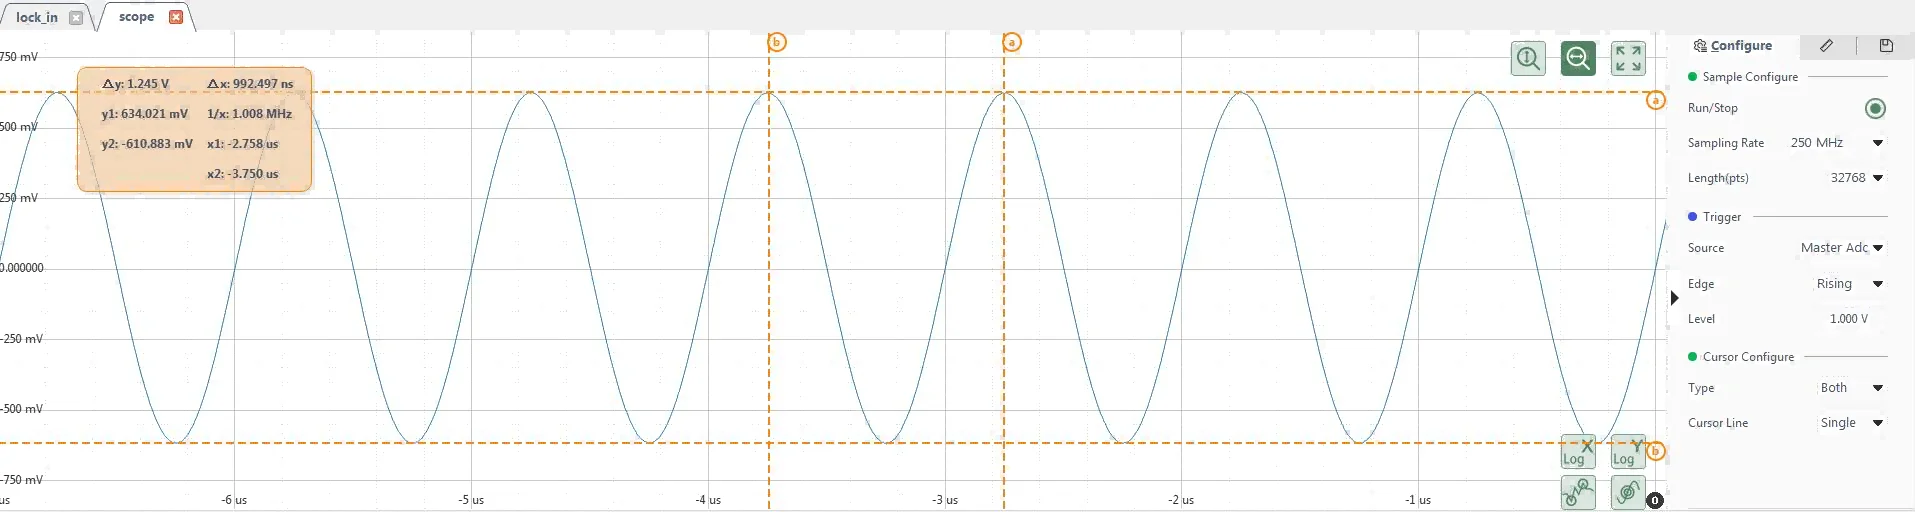
    The oscilloscope function features a single signal channel, supporting selectable inputs (signal, reference, and auxiliary) and outputs (signal and auxiliary). It offers various triggering modes and provides users with real-time display of time-domain signals. Each channel boasts a maximum sampling depth of 262,144 points and a maximum sampling rate of 250 MSPS.

  • FFT Spectrum Analysis

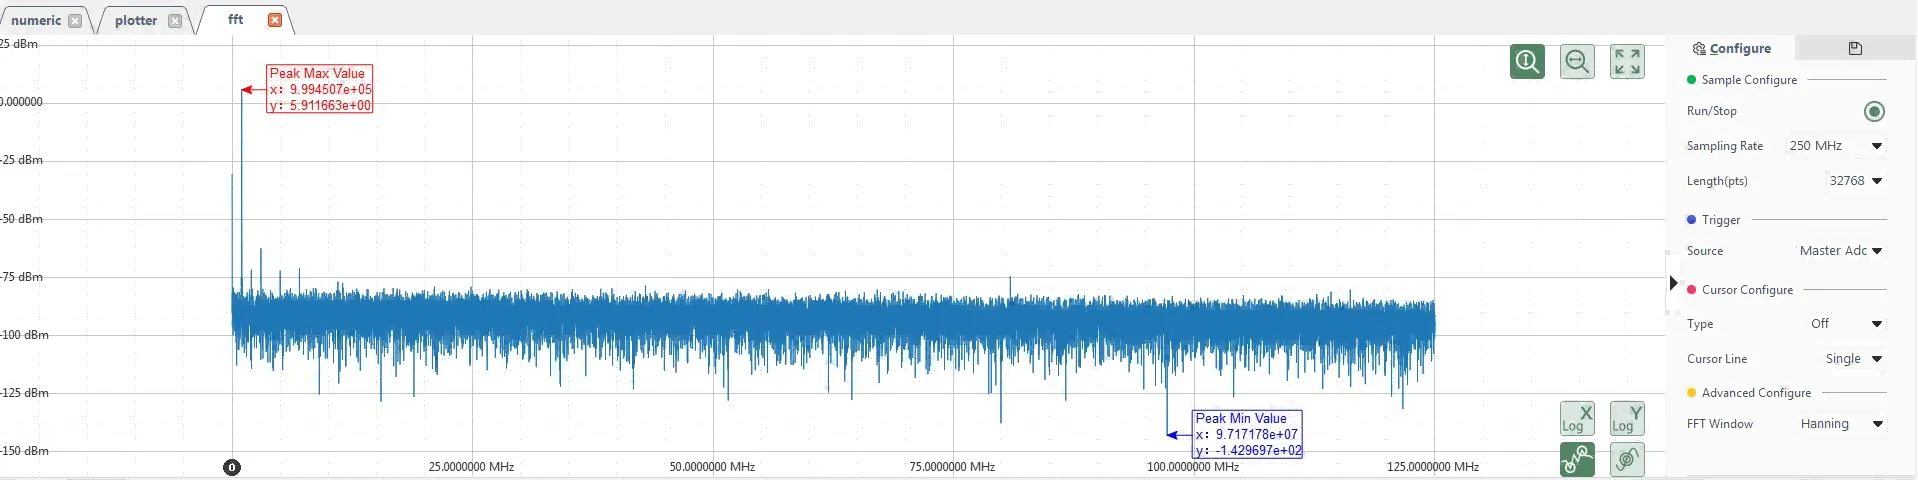
    The FFT spectrum analysis function analyzes the frequency-domain information of a signal based on waveforms captured by the oscilloscope. Depending on the sampling rate and sampling depth, the frequency resolution of the spectrum analysis ranges from approximately 0.01 Hz to 950 Hz.

  • PID Controller

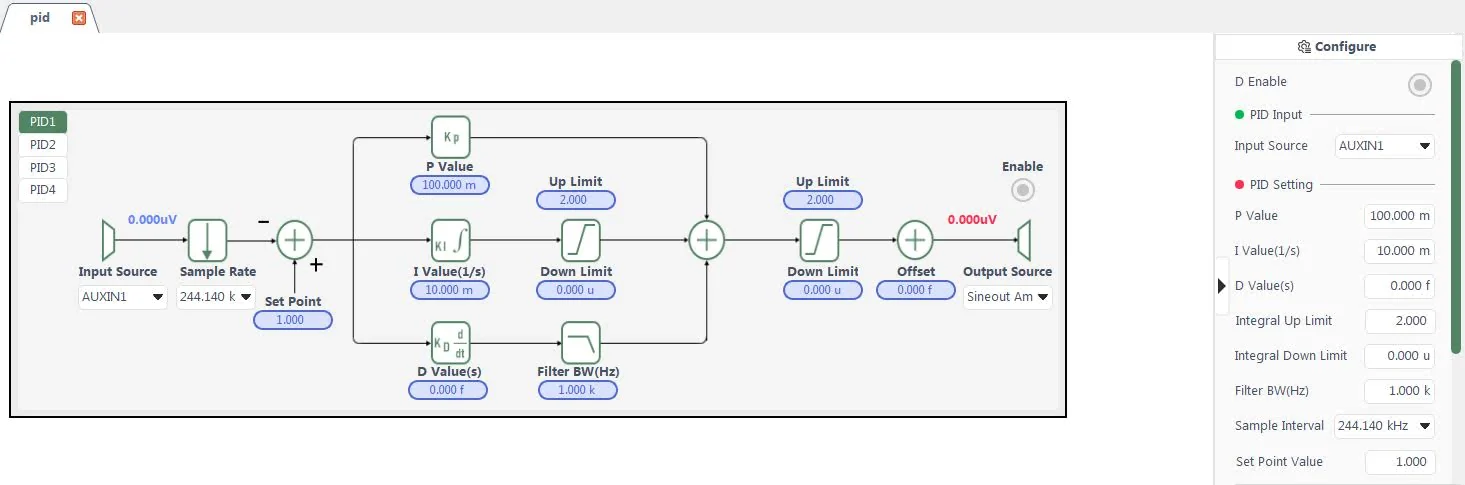
    The SE2031 features a built-in, independent dual-channel digital PID controller with a sampling rate of up to 3.9 MSPS. Tightly integrated with the lock-in amplifier, the PID controller utilizes demodulator measurements to control output signal parameters—such as amplitude, phase, and frequency—thereby enabling the precise regulation of various controlled variables.

  • Parameter Scanner

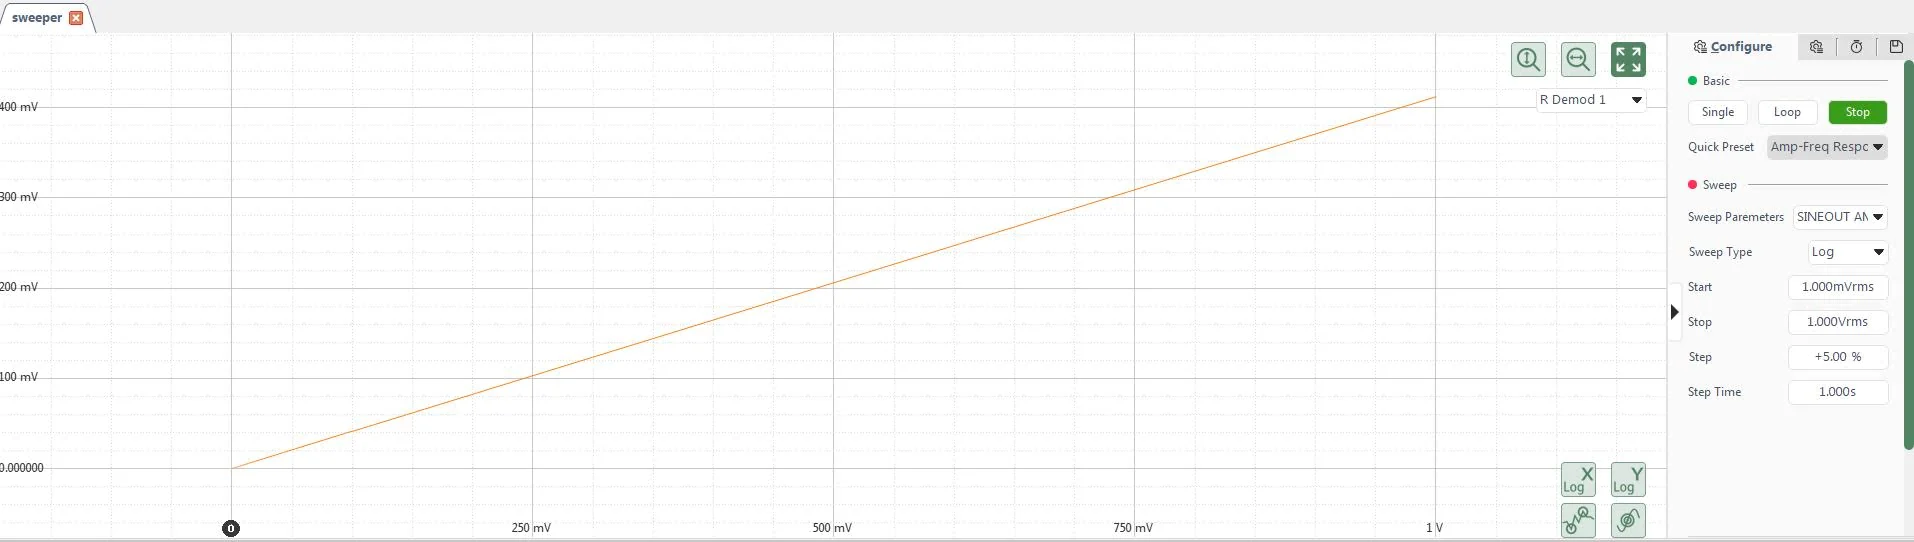
    The parameter scanner provides users with convenient, rapid scanning capabilities, enabling the real-time plotting of curves such as frequency and amplitude responses, and offers both single-sweep and continuous-loop scanning modes.

  • Plotter

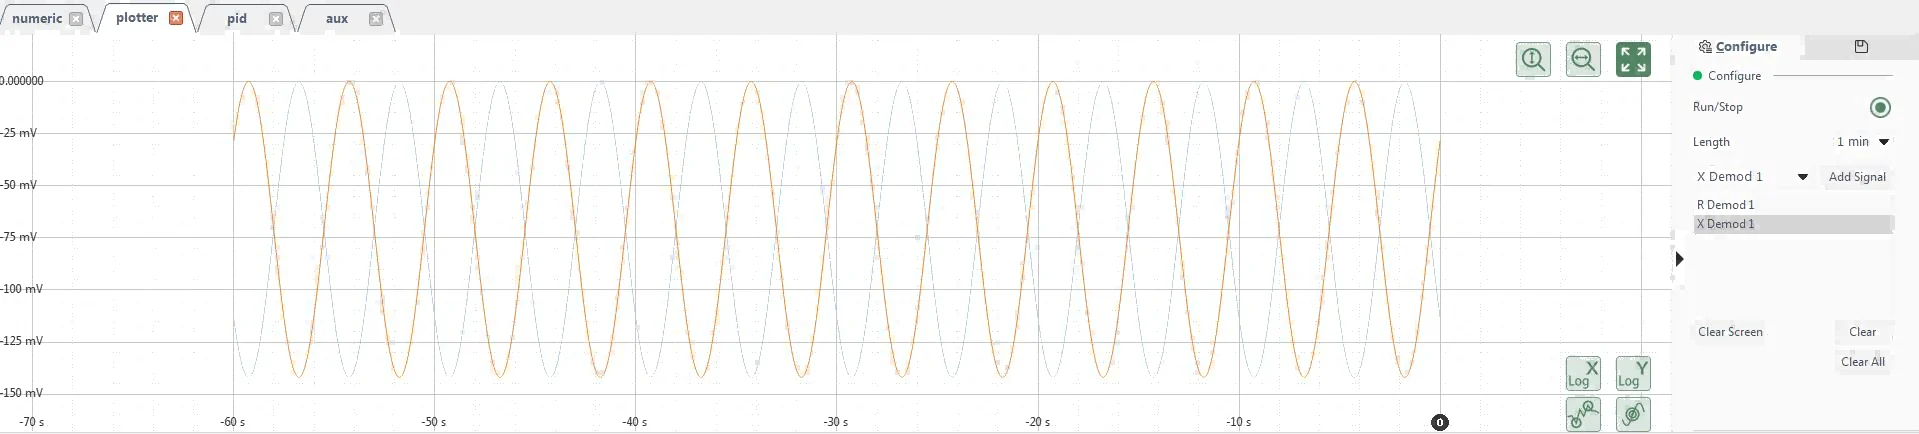
    The plotter function offers a rich array of features, including the ability to continuously scroll and display changing time-domain data waveforms, flexibly scale both the horizontal and vertical axes, display various measurement values, toggle between linear and logarithmic coordinates, and show the maximum and minimum values ​​of the current waveform.

  • Multiple Application Areas

    Scanning microscope: AFM, STM, SPM

    Materials: Carrier mobility, Carrier density, Hall effect, Ultrasonic materials

    Transport measurement: Conductivity measurement, Impedance measurement

    Noise represents: Noise density, Cross-correlation measurement

    Optical experiment: Spectral analysis, Spectral measurement, THz measurement, TDLAS

    Sensor measuring: Gyroscope, Photoelectric sensor, Resonator, Accelerometer

    Magnetic Sensor: SQUIDs, NV color center, Atomic Magnetometer, VSM

    Biomedical: Microfluidic


       << Click to find more solutions ! >>

  • EPR Measurement

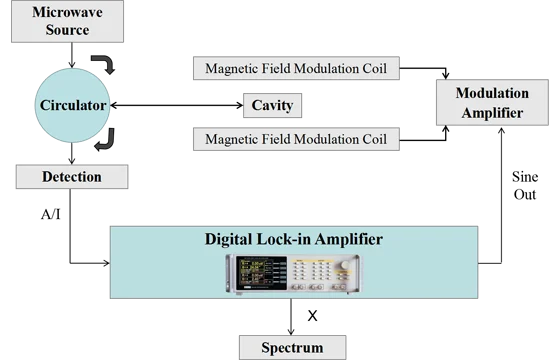
    Electron paramagnetic resonance (EPR) or electron spin resonance (ESR) is one of the most informative techniques for understanding the electronic structure of paramagnetic substances. EPR spectroscopy is particularly useful for studying (bio)chemical systems with strong local spin densities and their interactions with the environment.


    EPR measurements are usually performed in continuous wave (CW) or pulsed (Pulse) mode. The cwEPR spectrometer (see figure) applies a magnetic field of about 0.35 T and measures microwave absorption (X-band) in the 9-10 GHz range. Typically, the microwaves are kept at a fixed frequency and sweep the magnetic field (from 0 mT – 700 mT for the X-band).

  • Trusted by Universities and Research Institutes Around the World!

    Typical Customers:

    •  The Hong Kong Polytechnic University

    •  Universität Regensburg

    •  Rice University

    •  Weizmann Institute of Science

    •  University of Wisconsin-Madison

    •  Massachusetts Institute of Technology

    •  University of Texas at Austin

    •  Northeastern University


    You can trust us !

1. Signal Channel
Voltage Input Mode

Single-ended or Differential

Full-scale Sensitivity

1 nV to 2 Vrms

Impedance

Voltage: 50 Ω// 10pF or 10 MΩ// 10pF, AC or DC coupled

C.M.R.R

>80 dB to 100 Hz,  >70 dB to 1 MHz

Dynamic Reserve

> 120 dB

Gain Accuracy

0.5% typ (<1 MHz), 3% max

Voltage Noise

3.5 nV/√Hz @100kHz,  3 nV/√Hz @1 MHz

Gounding

BNC shield can be grounded or floated via 1 kΩ to ground

2. Reference Channel
Input

•  Frequency range:  DC to 10 MHz

•  Reference input: Square wave or sine wave

•  Input impedance: 50Ω//10pf, 1 MΩ//10pF

Phase

•  Resolution: 0.001 deg

•  Absolute phase error: < 1 deg typ (<1 MHz), 5 deg max

•  Relative phase error: < 1 mdeg

•  Orthogonality: 90° ± 0.001°

•  Phase noise: (Internal ref.) Synthesized, <0.0001°rms at 1 kHz;  (External ref.) 0.005°rms at 1 kHz (100 ms time constant, 12 dB/oct)

•  Drift: <0.01°/℃ below 100 kHz, <0.1°/℃ above 100 kHz

Harmonic Detection

2F, 3F, …nF to 10 MHz  (n<32767)

Acquisition Time

•  Internal ref.: instantaneous acquisition

•  External ref.: (2 cycles + 5 ms) or 40 ms, whichever is larger

3. Demodulator
Stability

•  Digital output: no zero drift on all setting

•  Display: no zero drift on all setting

•  Analog output: <200 ppm/℃

Time Constant

100 ns to 3 ks (6,12,18,24, 30,36,42,48 dB/oct rolloff)

Synchronous Filters

Effective below 1 MHz with a rolloff greater than 18 dB/octave.

4. Internal Oscillator
Frequency

•  Range: 1 mHz to 10 MHz

•  Accuracy: 2 ppm + 1 µHz


Distortion

-75 dBFS (f=100 kHz)

-60 dBFS (f=1 MHz)

Amplitude

1 μV to 2 Vrms

Accuracy

0.5% typ (f<1 MHz),  3% max

Stability

< 200 ppm/℃

TTL Output

3.3V TTL/CMOS level

5. Interface

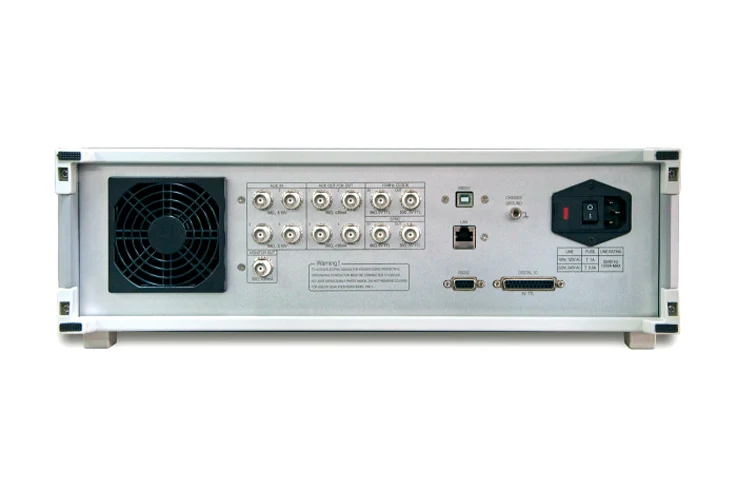
USB2.0 and RS-232(DB-9) and 1000Mbps Enthernet

6. Inputs & Outputs
AUX Inputs

•  Function: 4 channel inputs

•  Voltage: ±10 V full scale, 0.3 mV resolution

•  Impedance: 1 MΩ

AUX/CH Outputs

•  Function: 4 channel inputs

•  Voltage: ±10 V full scale, 0.3 mV resolution


Drive Current

30 mA max output current

7. Display
Screen

5.6 inch, 640×480 TFT

Screen Format

Single or dual display

Display Quantities

Each display shows one trace, traces can be defined as X,Y,R,θ

Display Types

Numerical form, bar graph

8. General
Power Requirement

•  Voltage: 100 – 240 VAC

•  Frequency: 50/60 Hz

•  Power: 50 W (typ.)

Dimension

•  448 (W) × 148 (H) × 513 (D) mm  (with feet)

•  448 (W) × 133 (H) × 470 (D) mm  (without feet)

Main Machine

Module No. Item Description
SE2031 Digital Lock-in Amplifier 1 mHz to 10 MHz, 1 nV to 1 V full-scale sensitivity
Saluki Technology