
Experiment name: Lamb wave signal acquisition in homogeneous aluminum plate.
Research direction: Structural non-destructive testing and damage monitoring based on ultrasonic guided waves.
Experimental content: Using PZT (piezoelectric sensor) as the excitation sensor and receiving sensor, test the Lamb wave signal in the homogeneous aluminum plate (2024).
Test purpose: to collect the signals of the two modes of symmetry (S0) and antisymmetric (A0) that coexist in the Lamb wave fundamental frequency, and to distinguish the two modes by extracting parameters of the time domain signal.
Amplifier in experimental significance:
This paper strictly derives the Lamb wave time domain model by considering the dispersion characteristics of the two fundamental frequency modes of the Lamb wave, and obtains a coupling term that does not change with the propagation time, which can be used for mode distinction. Its conclusion solves the multi-mode problem in guided wave non-destructive testing technology. The excitation waveform must be strictly controlled during verification testing, requiring a power amplifier that performs well under high frequency/bandwidth conditions.
Test equipment: SLA-HV-200D (power amplifier), PCI-1714 (data acquisition card), PCI-1721 (data output card).
Experimental process (1):
A high-frequency modulation waveform is generated through a self-written LABVIEW program, which is amplified through a power amplifier through a data output card to drive the force sensor, and then the waveform signal is received through a data acquisition card. The structure under test is shown in Figure 1.a, and the experimental device is shown in Figure 1.b:
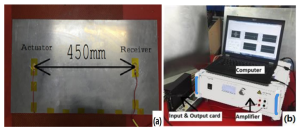
Figure 1, (a) Tested structure, (b) Experimental device.
Test results (1):
This result is used to analyze the parameter extraction accuracy under different excitation bandwidths. The test results and fitting results are as follows:
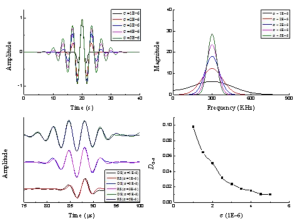
Figure 2. (a) Different excitation waveforms controlled by bandwidth factor. (b) Corresponding Fourier transform results. (c) Sampling results (OS) and fitting results (RS). (d) Correlation analysis between fitting results and sampling results.
This result is completely consistent with the trend of the theoretical results, which reflects that the amplifier fully meets the ideal assumptions under different bandwidths.
Experimental process (2):
By testing a larger plate-like structure, the schematic diagram of the tested structure is as follows:
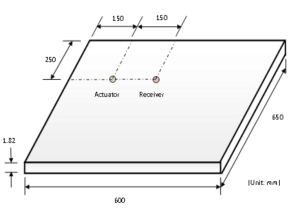
Figure 3. Schematic diagram of the structure under test.
Test Results:
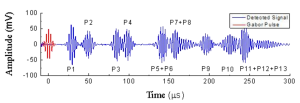
Figure 4. Measurement signal (blue line) and excitation signal (red line), excitation P-P voltage: 36V.
The measurement signal verifies the correctness of the theoretical derivation, and it can be seen from the signal that the electromagnetic noise of the entire signal is very small, which is closely related to the stability of the amplifier.
The performance of the amplifier in this experiment: providing a stable amplified signal to excite the PZT sensor to excite a nearly ideal excitation waveform. In the experiment, the capacitance of PZT was 3.42nF.
