
SE1022 Digital Lock-in Amplifier is one of the best-seller products of Saluki Technology. It provides an excellent performance within its bandwidth from 1 mHz to 102 kHz. With the advantage of the latest digital signal processing technology and high-precision 24-bit ADC, SE1022 can easily detect the phase and the magnitude of weak signals overwhelmed by various large noises.
The performance of SE1022 is as good as other lock-in amplifiers brands, even better in some certain parameters. In this section, we mainly show you the low current test comparison between Saluki SE1022 Lock in Amplifier and SRS SR830 Lock in Amplifier.
Test Equipments:
Lock-in amplifier: SR830, SE1022.
Current source: KEITHLEY’s 6221 DC/AC current source.
Lock-in Amplifier Measurement Configuration:
1. Select the current file “I”.
2. Select current gain, SE1022 is “1M”, SR30 is “I(106)”, and the contacts are the same.
3. Select the alternating current circulation mode “AC”, and the grounding mode is floating “GROUND”.
4. Select the internal reference signal “Internal”.
5. Time constant time constant is “300ms”, and the filter roll-off is “24 dB/oct”.
6. Dynamic reserve selection “low”.
7. Sensitivity can be appropriately modified according to specific conditions.
8. Other select default settings.
KEITHLEY’s 6221 Configuration:
1. The three-axis output terminal is configured as “Triax internal shield = output low, Triax output low = earth ground”.
2. Set the output signal to be a sine signal with a frequency of 997Hz.
3. Limit the output voltage compliance voltage to 1.00V.
4. Set the amplitude of the sinusoidal signal as required.
5. Other select default settings.
1. pA Level Small Current Measurement Accuracy and Stability Analysis
Set the amplitude of the output sinusoidal current signal of the 6221 current source to 0.0100nA RMS, connect the two lock-in amplifier to the computer via USB, and continuously read and measure the current amplitude through the Lab VIEW program to get the current curve with time, such as error! The reference source was not found.
* Under same configuration, measure 10pA current(997Hz) with 1000 test points
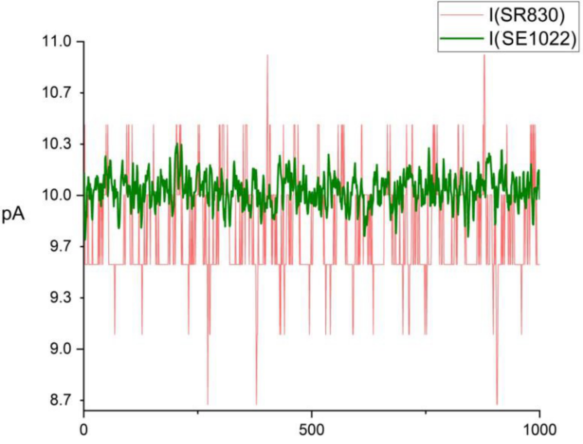
Figure 1 Stability analysis of pA level small current measurement
It can be clearly seen from the above figure that compared with SR830, SE1022 measures pA current more accurately and stably. The calculation shows that the average current measured by SE1022 is 10.038 pA and the standard deviation is 0.096 pA. The average current measured by SR830 is 9.777 pA and the standard deviation is 0.311 pA.
2. Current Noise Floor Test
Configure according to the content described in the second part.
1) Set the current gain of SE1022 lock in amplifier to “100 M” and the current gain of SR830 to “I(108)”.
2) The input port is open and no load is connected.

Figure 2 997Hz current noise floor test results
As shown in Figure 2, in the case of 997Hz, the noise floor of SE1022 dsp lock in amplifier is less than 20fA, while the noise floor of SR830 is greater than 120fA.
3. Amplitude-frequency Characteristic Measurement of Current
Configure as described in Part 2, the differences are:
1) Set the amplitude of the sinusoidal current signal output by the 6221 current source to an effective value of 1.0000nA RMS.
2) Set the frequency of the sinusoidal current signal output by the 6221 current source to 1kHz, 5kHz, and 10kHz in sequence.
3) Set the lock time constant to 30ms and the sensitivity to 2nA.
The measurement results of lock in amplifier are shown in Figure 3. It can be seen that as the frequency increases, the measured current amplitude has a certain degree of attenuation.
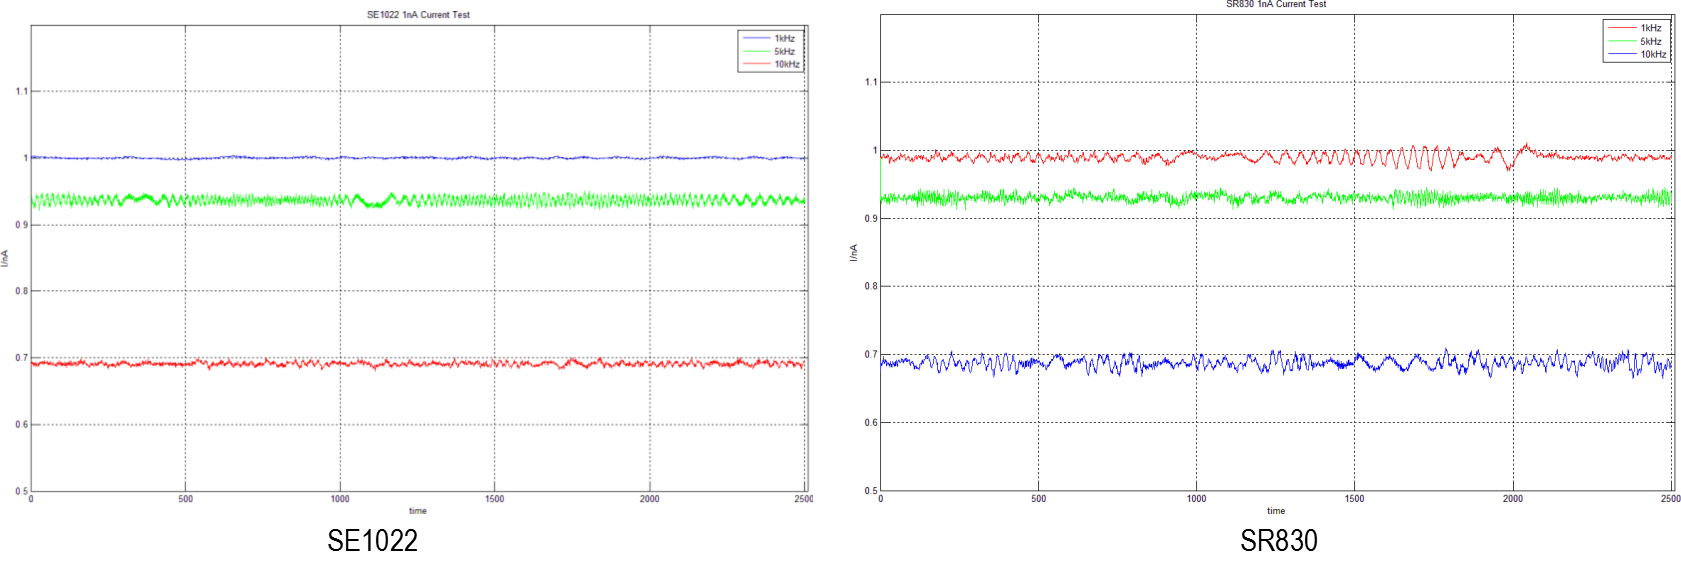
Figure 3 Test results of 1nA current input signal at different frequencies
Table 1 1nA current measurement results
| Lock-in Amplifier | Parameter | 1kHz | 5kHz | 10kHz |
| SE1022 | average | 1.0002nA | 0.9366nA | 0.6911nA |
| standard deviation | 1.2888pA | 5.4411pA | 2.8787pA | |
| SR830 | average | 1.2888pA | 0.9303nA | 0.6873nA |
| standard deviation | 5.9404pA | 5.3449pA | 7.3959pA |
Modify the frequency of the output sinusoidal current signal of the 6221 current source to 50kHz, and increase the sensitivity of the lock and amplifier appropriately, and the results are shown in Figure 4. It can be seen that the measured results of the two lock amplifiers are both greater than 1nA, and the calculation shows that the average current measured by SE1022 is 3.1343nA, and the standard deviation is 78.716pA, the average current measured by SR830 is 4.5081nA, and the standard deviation is 564.60pA.
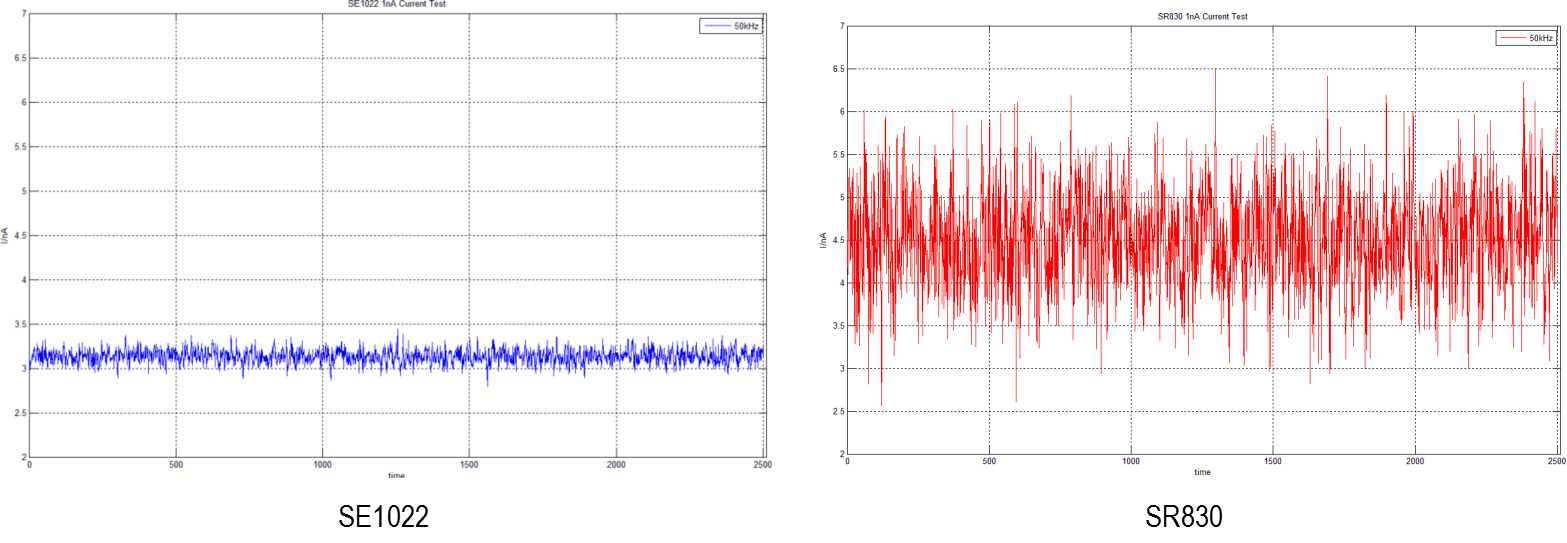
Figure 4 Lock-in amplifier measures 1nA at 50kHz
4. Amplitude-frequency Characteristic Measurement in Low Frequency Range of Current Gear
The test platform is similar to the above-mentioned platform, except that the current source is replaced with a photodiode. By controlling the angle of the grating in the monochromator and changing the intensity of the light reaching the photodiode, the magnitude of the photocurrent input to the lock-in amplifier can be controlled. The use of photodiodes instead of current sources is to obtain a current signal with a low signal-to-noise ratio. The setup of the lock-in amplifier is similar to Part 2, but you need to change the reference signal to External, turn on the synchronization filter, and change the time constant to 3s.
The frequency of the signal is changed by the chopper, increasing from 20Hz to 190Hz.
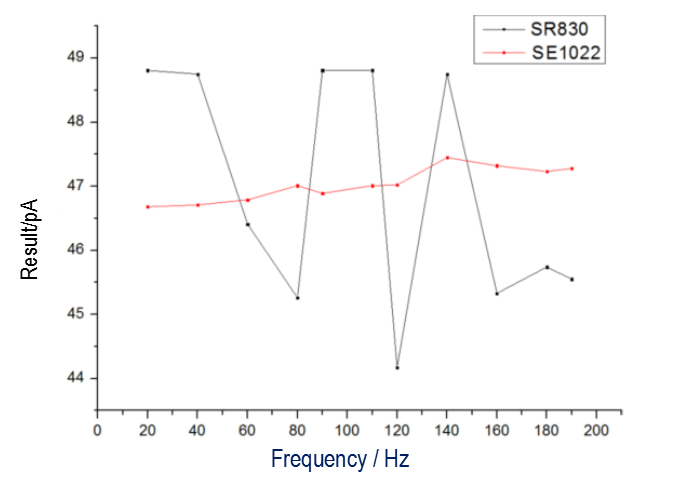
Figure 5 Amplitude-frequency response curve
The measured value of SE1022 is more stable than SR830, and the fluctuation is smaller.
In an ideal situation, the current amplitude measured by the lock release does not change with the change of the chopping frequency. As can be seen from the above figure, in the low frequency range of 20-190Hz.
